
How a 30-Day Vacancy Affects Your Annual NOI
An owner reviews a year-end statement, sees a single 30-day gap between tenancies, and mentally subtracts one month of rent. The property still performed, the reasoning goes, minus one twelfth.
That subtraction is wrong in three directions, and all three run the same unfavorable way. It understates the rent forgone, because vacancy is measured in days and rarely lands on a calendar month. It ignores that the unit kept spending money the entire time it produced nothing. And it treats the loss as something a later rent increase can offset, which is not how vacancy behaves.
What follows is the arithmetic. Not how to shorten a vacancy, which is covered in reducing vacancy between tenants in South Florida, and not the full expense stack of a turnover event, which is broken out in the true cost of tenant turnover. This is the narrower question: what does one 30-day vacancy do to annual NOI, and what does it do when the same interval repeats across several properties and several years.
Every figure in this article is illustrative round arithmetic selected for legibility. Nothing here is market data, an average rent, an observed vacancy duration, a cap rate, a benchmark, or a projection. The numbers exist only to demonstrate structure. Actual figures for any property depend on that property, its submarket, its expense base, and its lease.
This is written for owners holding multiple South Florida residential rentals and for fiduciaries administering them. It is not written for a single-unit owner handling their own showings, and it does not apply to short-term rental operations, where nightly pricing, occupancy patterns, and expense structure make vacancy a fundamentally different calculation.
Convert the Rent Into a Daily Number First
Monthly rent is a billing convention. Vacancy is a duration. Until the two are expressed in the same unit, the loss cannot be measured accurately.
Take a hypothetical single-family rental at $3,000 per month. That is $36,000 of annual gross scheduled rent. Divided by 365 days, the unit produces roughly $98.63 per day of scheduled rent.
That conversion is where most owner estimates quietly break down, for reasons that are structural rather than careless:
- Vacancy does not respect month boundaries. A tenant vacates on the 9th and the new lease starts on the 12th of the following month. That is 33 days, not “about a month,” and the three extra days are nearly $300 that never enters anyone’s mental model.
- Monthly thinking rounds toward the comfortable number. “Roughly a month” absorbs anything from 26 to 38 days, and the error runs toward the longer interval, because the forgotten days are the ones added at the end while a final item is finished.
- Prorated periods disappear from summaries. Partial-month figures on a statement do not read like losses. They read like accounting.
A daily number removes all of that. Every decision that adds a day carries a price known before the decision is made rather than reconstructed afterward.
What a 30-Day Vacancy Costs as a Share of the Year
At the hypothetical daily rate, 30 vacant days remove roughly $2,959 of scheduled rent. Against $36,000 of annual gross scheduled rent, that is about 8.2% of the unit’s entire year of income, lost in one interval.
Now consider what that 8.2% does to the number owners actually care about.
Assume the same hypothetical unit carries $22,000 of annual operating expenses — taxes, insurance, association dues where applicable, maintenance, landscaping and pest, administration, and management. At full occupancy the unit would produce $36,000 of income against $22,000 of expense, for $14,000 of NOI.
Remove 30 days of rent. Income drops to $33,041. The expenses do not drop with it, because nearly all of them are time-based rather than occupancy-based. NOI falls to roughly $11,041.
That is the entire point of the exercise. An 8.2% reduction in gross income produced a 21% reduction in NOI. Vacancy lands on the net line with a multiplier, because the expense base underneath it is fixed and does not care whether the unit is occupied.
This is also why vacancy sits at the top of the lever list in how to maximize NOI on a South Florida rental property. Not because vacancy is the largest number on the statement, but because it is the largest number an owner can actually influence, and because it hits net income harder than it hits gross.
Vacancy Is Not Zero Income. It Is Negative Cash Flow.
The second error in the one-month subtraction is treating a vacant unit as neutral — nothing coming in, nothing going out. A vacant South Florida residential property is not neutral. It is a small operating business with no revenue.
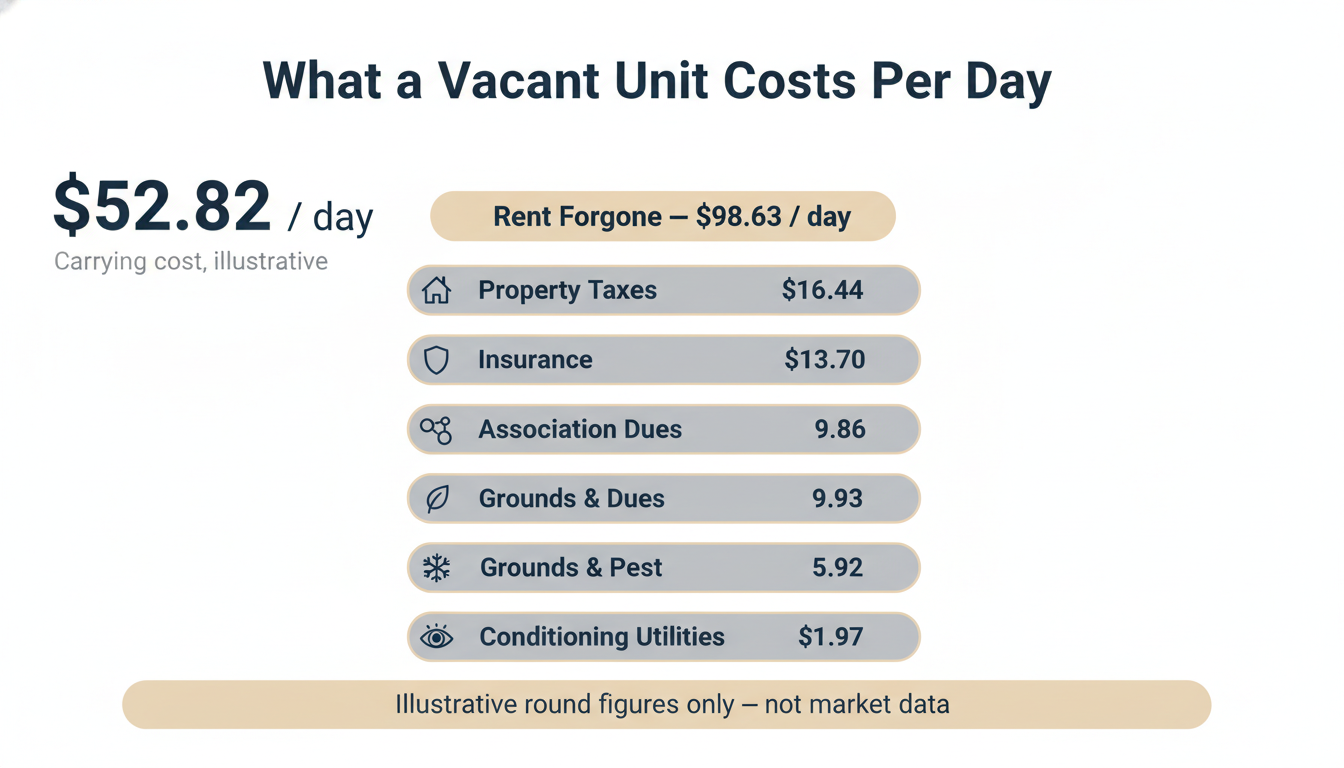
Using illustrative annualized figures on the same hypothetical unit, converted to a daily basis:
| Cost that continues during vacancy | Illustrative annual | Per day |
|---|---|---|
| Property taxes | $6,000 | $16.44 |
| Property insurance | $5,000 | $13.70 |
| Association dues, where applicable | $3,600 | $9.86 |
| Landscaping and pest control | $1,800 | $4.93 |
| Owner-paid utilities during vacancy, including humidity conditioning | $2,160 | $5.92 |
| Periodic monitoring and interior checks | $720 | $1.97 |
| Total carrying cost | $19,280 | $52.82 |
Over 30 days, that hypothetical unit consumes roughly $1,585 while producing nothing.
Two of those lines deserve specific attention in this climate.
Conditioning a vacant unit is not optional here. A closed, unconditioned residential interior in South Florida accumulates humidity, and sustained elevated indoor humidity creates conditions for microbial growth on interior surfaces and finishes. The U.S. Environmental Protection Agency addresses the relationship between indoor moisture and mold growth, and the U.S. Department of Energy covers indoor humidity control. Holding a controlled setpoint during vacancy is a real electricity cost. Not holding it converts a carrying cost into a remediation cost and extends the vacancy that created it.
Grounds and appearance matter more, not less, while a unit is empty. Declining landscaping signals absence and undermines showings. The expense easiest to pause is the one holding leasability in place.
So the honest accounting of a 30-day vacancy on this hypothetical unit is two separate figures, and both belong in the file:
- Rent forgone: roughly $2,959. Permanently gone.
- Cash consumed during the interval: roughly $1,585. Real outflow against zero revenue.
The carrying costs would have been incurred with a tenant in place as well. That is exactly why the period reads as negative rather than merely idle: the offsetting income was removed while the obligations continued. An owner who models vacancy as “no rent that month” has modeled half of the event.
The Recovery Myth
Nearly every other line on an operating statement is reschedulable. A deferred repair can be performed next quarter. A capital replacement can be sequenced into a different year. A vendor contract can be renegotiated at renewal. Timing is a lever.
A vacancy day has no such property. The 30 days above cannot be re-leased later; there is no mechanism by which an owner sells that inventory a second time. Residential rental income is perishable in the strictest sense: each day is offered once, and if it is not occupied, it is retired.
The corollary is the one owners resist most. A later rent increase does not recover a past vacancy. It changes the rate at which future days are sold. Consider the arithmetic on the same hypothetical unit:
- 30 vacant days removed roughly $2,959.
- A hypothetical $100 per month increase at the next renewal adds $1,200 over a 12-month term.
- Two and a half years of that increase are consumed before the original gap is closed — and only if nothing else interrupts, and only by ignoring that the increase would have been available regardless of whether the vacancy occurred.
That last clause is the whole argument. The increase and the vacancy are independent events. Crediting future rent growth against a past vacancy double-counts income the owner would have received anyway. The gap does not close. It is simply lapped by later performance and stops being visible.
This is the difference between an expense problem and an inventory problem. Expense problems can be managed on a timeline. Inventory problems have to be managed on the day.
How One Vacancy Multiplies Across a Portfolio
A single 30-day vacancy on a single property is an annoyance. The same operational interval applied across several properties is a structural drag on portfolio NOI, and it is invisible on any one property’s statement.
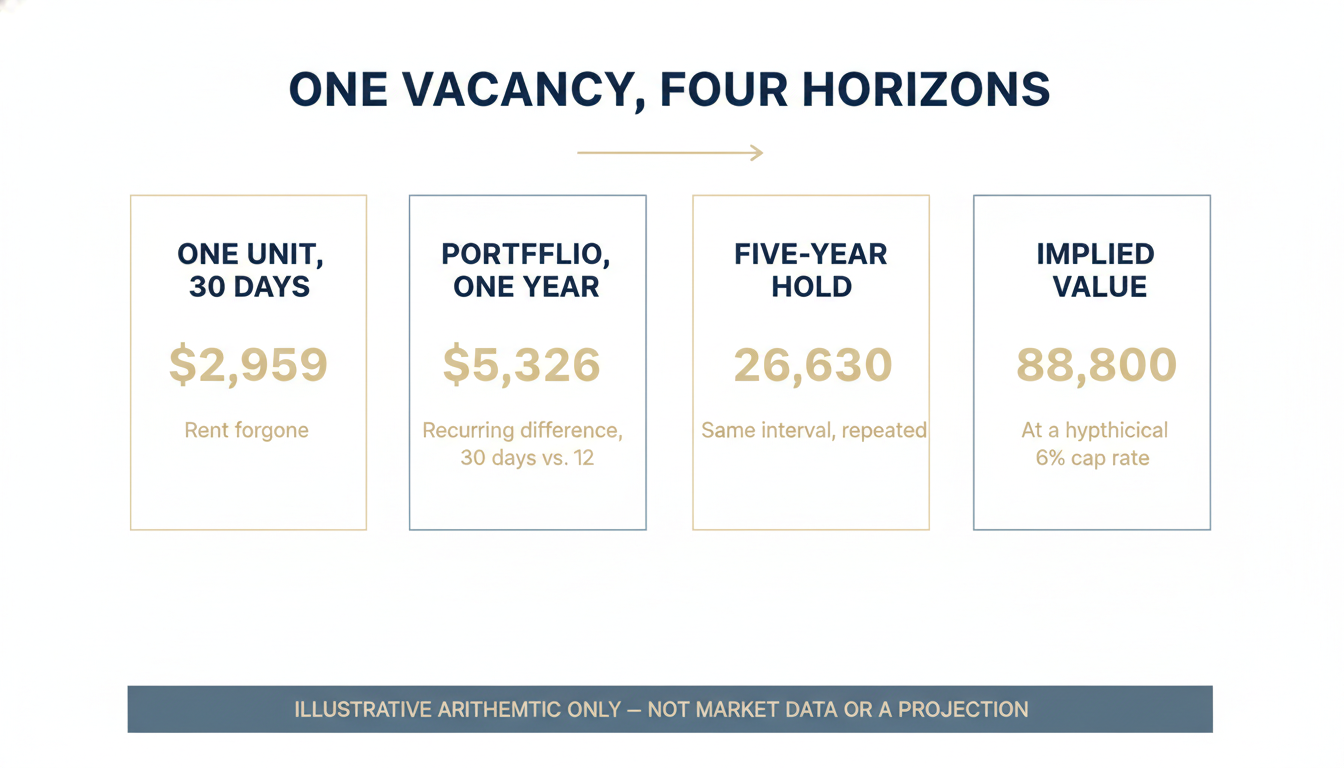
Take a hypothetical portfolio of six units, each at the same $3,000 monthly rent, each turning over on average once every 24 months. That produces three turnover events per year across the portfolio.
Illustrative annual portfolio vacancy at a 30-day interval:
| Item | Illustrative figure |
|---|---|
| Turnover events per year | 3 |
| Vacancy days per event | 30 |
| Total vacancy days per year | 90 |
| Rent forgone at $98.63 per day | $8,877 |
| Carrying cost consumed at $52.82 per day | $4,754 |
The same portfolio at a 12-day interval:
| Item | Illustrative figure |
|---|---|
| Total vacancy days per year | 36 |
| Rent forgone | $3,551 |
| Carrying cost consumed | $1,901 |
The recurring annual difference in rent alone is roughly $5,326, on a portfolio where nothing about the rents, the buildings, or the market changed. Only the interval changed.
Staggering is what makes this hard to see. Because the three turnovers fall in different months on different properties, no single statement ever shows a 90-day problem. Each property shows one ordinary gap. The portfolio total is only visible to someone reviewing all properties on the same reporting cadence — which is one of the practical reasons portfolio management services for multi-property investors report at the portfolio level rather than sending six unrelated statements.
How It Compounds Across a Multi-Year Hold
Extend the same illustration across a hypothetical five-year hold with no change in rent, no change in turnover frequency, and no change in expenses:
| Horizon | Illustrative recurring difference |
|---|---|
| One year | $5,326 |
| Three years | $15,978 |
| Five years | $26,630 |
Deliberately absent from that table: rent growth, expense inflation, and any assumption about market conditions. Adding them would require inventing figures, and the structure holds without them, because the interval is what is being measured.
What the table understates is that extended vacancies are usually not random. They are produced by the same missing processes each time — marketing that begins at move-out instead of at notice, turnover scope discovered rather than defined, vendors sourced on demand rather than held on a standing bench. An operation that produces a 30-day interval once tends to produce it again, because the cause is still in place.
The Valuation Effect Owners Miss
Vacancy days are usually filed as a cash-flow issue. For income-producing property they are also an equity issue, and that is the version that shows up at refinance or sale.
Income property value is commonly expressed as NOI divided by a capitalization rate. Any recurring, durable reduction in NOI therefore corresponds to a multiple of itself in implied value.
Apply that to the portfolio illustration. The recurring $5,326 annual NOI difference, at a hypothetical 6% capitalization rate, corresponds to roughly $88,800 of implied value. At a hypothetical 5.5%, roughly $96,800.
To be explicit: those cap rates are arbitrary round numbers used to demonstrate the multiplier. They are not market rates, not a forecast, and not applicable to any specific asset. Cap rates are set by market conditions, submarket, asset quality, and buyer underwriting, and no owner controls them.
The structural conclusion survives whatever rate is substituted. Vacancy days quietly reduce equity, not just distributions. And the effect is compounded at diligence, because a rent roll showing repeated extended gaps does more than lower the income figure a buyer underwrites. It tells the buyer that the income is uncertain, and buyers price uncertainty conservatively. The same operating record that produced the vacancy also produces the discount applied to it.
The Below-Market Renewal Trap
Once an owner internalizes what vacancy costs, a predictable overcorrection follows: accept whatever the sitting tenant will pay, because anything is better than an empty unit.
Sometimes that is correct. Often it is not, and the arithmetic is worth running before the decision rather than after.
Illustrative comparison on the same hypothetical unit, where a documented market review supports $3,000:
| Decision | Illustrative arithmetic | Cost |
|---|---|---|
| Renew at $2,800 for 12 months | $200 below market × 12 | $2,400 |
| Accept a 30-day vacancy, re-lease at $3,000 | 30 days × $98.63 | $2,959 |
On a single term, the concession looks like the cheaper choice, and on a single term it may be. The problem is that the comparison almost never stops at one term.
The discounted rent becomes the base for the next renewal, and the one after that. Three consecutive terms anchored to a below-market figure gives away roughly $7,200 in the illustration — more than double the hypothetical vacancy — and the gap has to be closed eventually. Closing it usually requires either a large single-year correction the tenant declines, or a turnover, which means the vacancy was deferred rather than avoided. The owner paid the concession and the vacancy.
The disciplined version is not “always hold rent” or “always concede.” It is a priced comparison, made in advance, on a documented timeline: what the unit supports today, what the likely alternative costs including carrying cost, how long the concession will be anchored, and what the decision is being traded for. Tenancy quality, payment history, and care of the property are legitimate inputs. A vague preference for avoiding an empty unit is not an input. It is an absence of analysis, and it is the difference between operational oversight and rent collection.
Reactive Model vs. Managed Model
| Operating dimension | Reactive model | Managed model |
|---|---|---|
| Unit of measure | Months of rent | Dollars per vacant day |
| Carrying cost during vacancy | Not tracked | Priced per day and reported |
| Vacancy start point | Move-out date | Notice date |
| Turnover scope | Discovered after the unit is empty | Defined at notice against a written standard |
| Vacant-unit conditioning | Utilities minimized to save cost | Humidity setpoint maintained and verified |
| Renewal decision | Concession to avoid an empty unit | Priced comparison against carrying-cost-inclusive alternative |
| Portfolio view | Six separate statements | One vacancy-day total across all properties |
| Valuation awareness | Cash flow only | Recurring NOI treated as an equity input |
The Fiduciary Version
For a trustee, executor, or personal representative administering South Florida residential rentals, vacancy arithmetic is not an optimization exercise. It is an accounting exposure.
A beneficiary reviewing an estate accounting can see a gap between tenancies. On the illustrative unit above, an avoidable 30-day vacancy is roughly $2,959 of income the trust did not receive, plus roughly $1,585 the trust spent while receiving nothing. Across four units in a single year, the same interval represents nearly $11,800 of forgone income on illustrative figures. That is a specific, quantifiable number, and a fiduciary should expect to be asked about it.
The defensible position is not zero vacancy, which no operation can promise. The defensible position is a documented interval with documented reasons: the date notice was received, the date marketing began, the scope of work performed and why, the dates showings and applications occurred, the pricing basis, and the date the new lease commenced. Vacancy that is explained is administration. Vacancy that is unexplained is inattention, and inattention on income-producing estate property is the exposure.
Beam’s approach to property management for trustees and estate executors treats that record as part of the deliverable rather than as something reconstructed when questions arrive.
How Beam Prices and Controls Vacancy Days
Beam Management Group treats vacancy as a metered daily cost across an owner’s properties rather than as an interval noticed after the fact:
- Establish the daily rent and daily carrying figure per unit, so every day of delay carries a known price at the moment a decision is made.
- Start the vacancy clock at notice, not at move-out, and trigger turnover scoping and marketing from that date.
- Define turnover scope against a written rent-ready standard before the unit is empty, so scope is executed rather than discovered.
- Hold vacant units at a controlled humidity setpoint with verified interior checks, so a carrying cost never becomes a remediation cost.
- Dispatch turnover work through a standing vendor bench with recurring volume rather than sourcing per incident.
- Price renewals against a documented market review and against the carrying-cost-inclusive alternative, with the rationale recorded.
- Report vacancy days as a portfolio total across all properties, not as isolated per-property gaps.
- Track the recurring NOI effect of the vacancy interval so its valuation impact is visible before a refinance or sale.
Each item shortens or prices an interval. That is the entire mechanism.
Review Your Vacancy Days Across the Portfolio
If your portfolio’s income is running below what the rent roll implies, start by converting each unit’s rent into a daily number and totaling the vacancy days across every property for the last twenty-four months. On illustrative figures, a routine 30-day interval repeated across a handful of staggered turnovers removes several thousand dollars of recurring annual NOI, and that recurring figure is the one a buyer or lender will eventually underwrite.
Beam Management Group runs vacancy as a measured operational interval: priced per day, started at notice, scoped against a written standard, executed through a standing vendor bench, and reported at the portfolio level. For trustees, executors, and inheritors accountable for income performance, the same process produces a documented interval with documented reasons — which is what an accounting to beneficiaries actually requires.
Beam is built for multi-property owners and fiduciaries who measure results in net operating income rather than in gross rent. Contact Beam Management Group to review your actual vacancy days across every property and what closing that interval is worth annually.
FAQ
How do I calculate the daily cost of a vacant rental unit?
Divide annual gross scheduled rent by 365 to get the daily rent figure, then divide each annualized carrying cost by 365 and add them. On an illustrative $3,000 per month unit, that is roughly $98.63 per day of rent, plus a hypothetical $52.82 per day of taxes, insurance, association dues, grounds care, conditioning utilities, and monitoring. Keep the two figures separate: the rent is permanently forgone income, while the carrying cost is cash consumed with no offsetting revenue. These figures are illustrative round numbers, not market data.
What percentage of annual income does a 30-day vacancy represent?
Thirty days is roughly 8.2% of a 365-day year, so a 30-day vacancy removes about 8.2% of that unit’s annual gross scheduled rent. The effect on net operating income is larger, because operating expenses are time-based rather than occupancy-based and do not fall when the unit empties. On the illustrative unit in this article, an 8.2% reduction in gross income produced roughly a 21% reduction in NOI. The specific ratio depends entirely on a given property’s expense base.
Which expenses continue while a rental unit is vacant?
Substantially all of the time-based ones. Property taxes, insurance, association dues where applicable, landscaping and pest control, administrative costs, and monitoring continue regardless of occupancy. Owner-paid utilities typically increase during vacancy in South Florida because the unit must be conditioned to control indoor humidity. That combination is why a vacant unit produces negative cash flow rather than neutral cash flow, and why modeling vacancy as simply “no rent this month” understates the event.
Can a rent increase later recover a past vacancy?
No. A vacancy day is perishable inventory that is offered once, and a later increase changes the rate on future days rather than restoring past ones. On illustrative figures, a $100 per month increase would need roughly two and a half years to equal a 30-day vacancy at a $3,000 rent — and the increase would have been available whether or not the vacancy occurred, so crediting it against the gap double-counts income. This is the structural difference between a vacancy and a deferrable expense.
How does vacancy across a portfolio differ from vacancy on one property?
The interval is the same, but the total is invisible. With staggered turnovers, no single property statement ever shows the aggregate. On an illustrative six-unit portfolio with three turnover events per year, a 30-day interval produces 90 vacancy days annually, while a 12-day interval produces 36. The recurring annual difference in the illustration is roughly $5,326 in forgone rent with no change to rents, buildings, or market conditions. Seeing it requires reporting vacancy days as one portfolio number.
Does vacancy affect property value or only cash flow?
Both. Income property value is commonly expressed as NOI divided by a capitalization rate, so a recurring reduction in NOI corresponds to a multiple of itself in implied value. Using a hypothetical 6% cap rate purely to demonstrate the multiplier, a recurring $5,326 annual NOI difference corresponds to roughly $88,800 of implied value. Cap rates are set by the market and by asset specifics and are not controllable by any owner. The point is directional: recurring vacancy reduces equity as well as distributions.
Is accepting a below-market renewal cheaper than a vacancy?
Sometimes for one term, rarely across several. On illustrative figures, a $200 monthly concession over twelve months costs $2,400 against a $2,959 thirty-day vacancy, so the concession appears cheaper. But the discounted rent becomes the base for subsequent renewals. Three anchored terms give away roughly $7,200, and the gap usually still has to be closed through a turnover later. The decision should be a priced comparison made in advance, including carrying cost and the anchoring effect, rather than a general preference for avoiding an empty unit.
What should a trustee document about a vacancy on estate-held property?
The interval and the reasons for it. Record the date notice to vacate was received, the date marketing began, the turnover scope performed and its justification, showing and application activity, the pricing basis for the new lease, and the lease commencement date. No operation can promise zero vacancy, so the defensible standard is an explained interval rather than an absent one. Estate accounting requirements vary by jurisdiction and instrument, so trustees should confirm expectations with Florida counsel and the estate’s CPA.